01. Overview
TCSS (Tropical Cyclone Severity Scale) is a full-stack meteorological platform engineered to visualize the multi-hazard impact of tropical cyclones. I developed the software implementation of the severity scale originally established by Bloemendal et al., transforming their research framework into an interactive, data-driven dashboard for real-time and historical storm analysis.
The platform aggregates complex atmospheric data, including wind speeds, storm surges, and rainfall totals, to provide a unified severity metric. By monitoring live feeds from the NHC and NDFD, the system offers instant, high-resolution insights into evolving threats, grounding the academic scale in a functional, user-facing application.
02. Engineering & ETL Pipeline
The core of the project is a high-performance Python ETL pipeline that manages the lifecycle of high-resolution meteorological data.
- GRIB Processing: Developed a pipeline using Xarray and Cartopy to ingest NDFD GRIB2 files, performing stateful imputation to handle missing data frames and converting raw atmospheric variables into color-mapped PNG hazard layers.
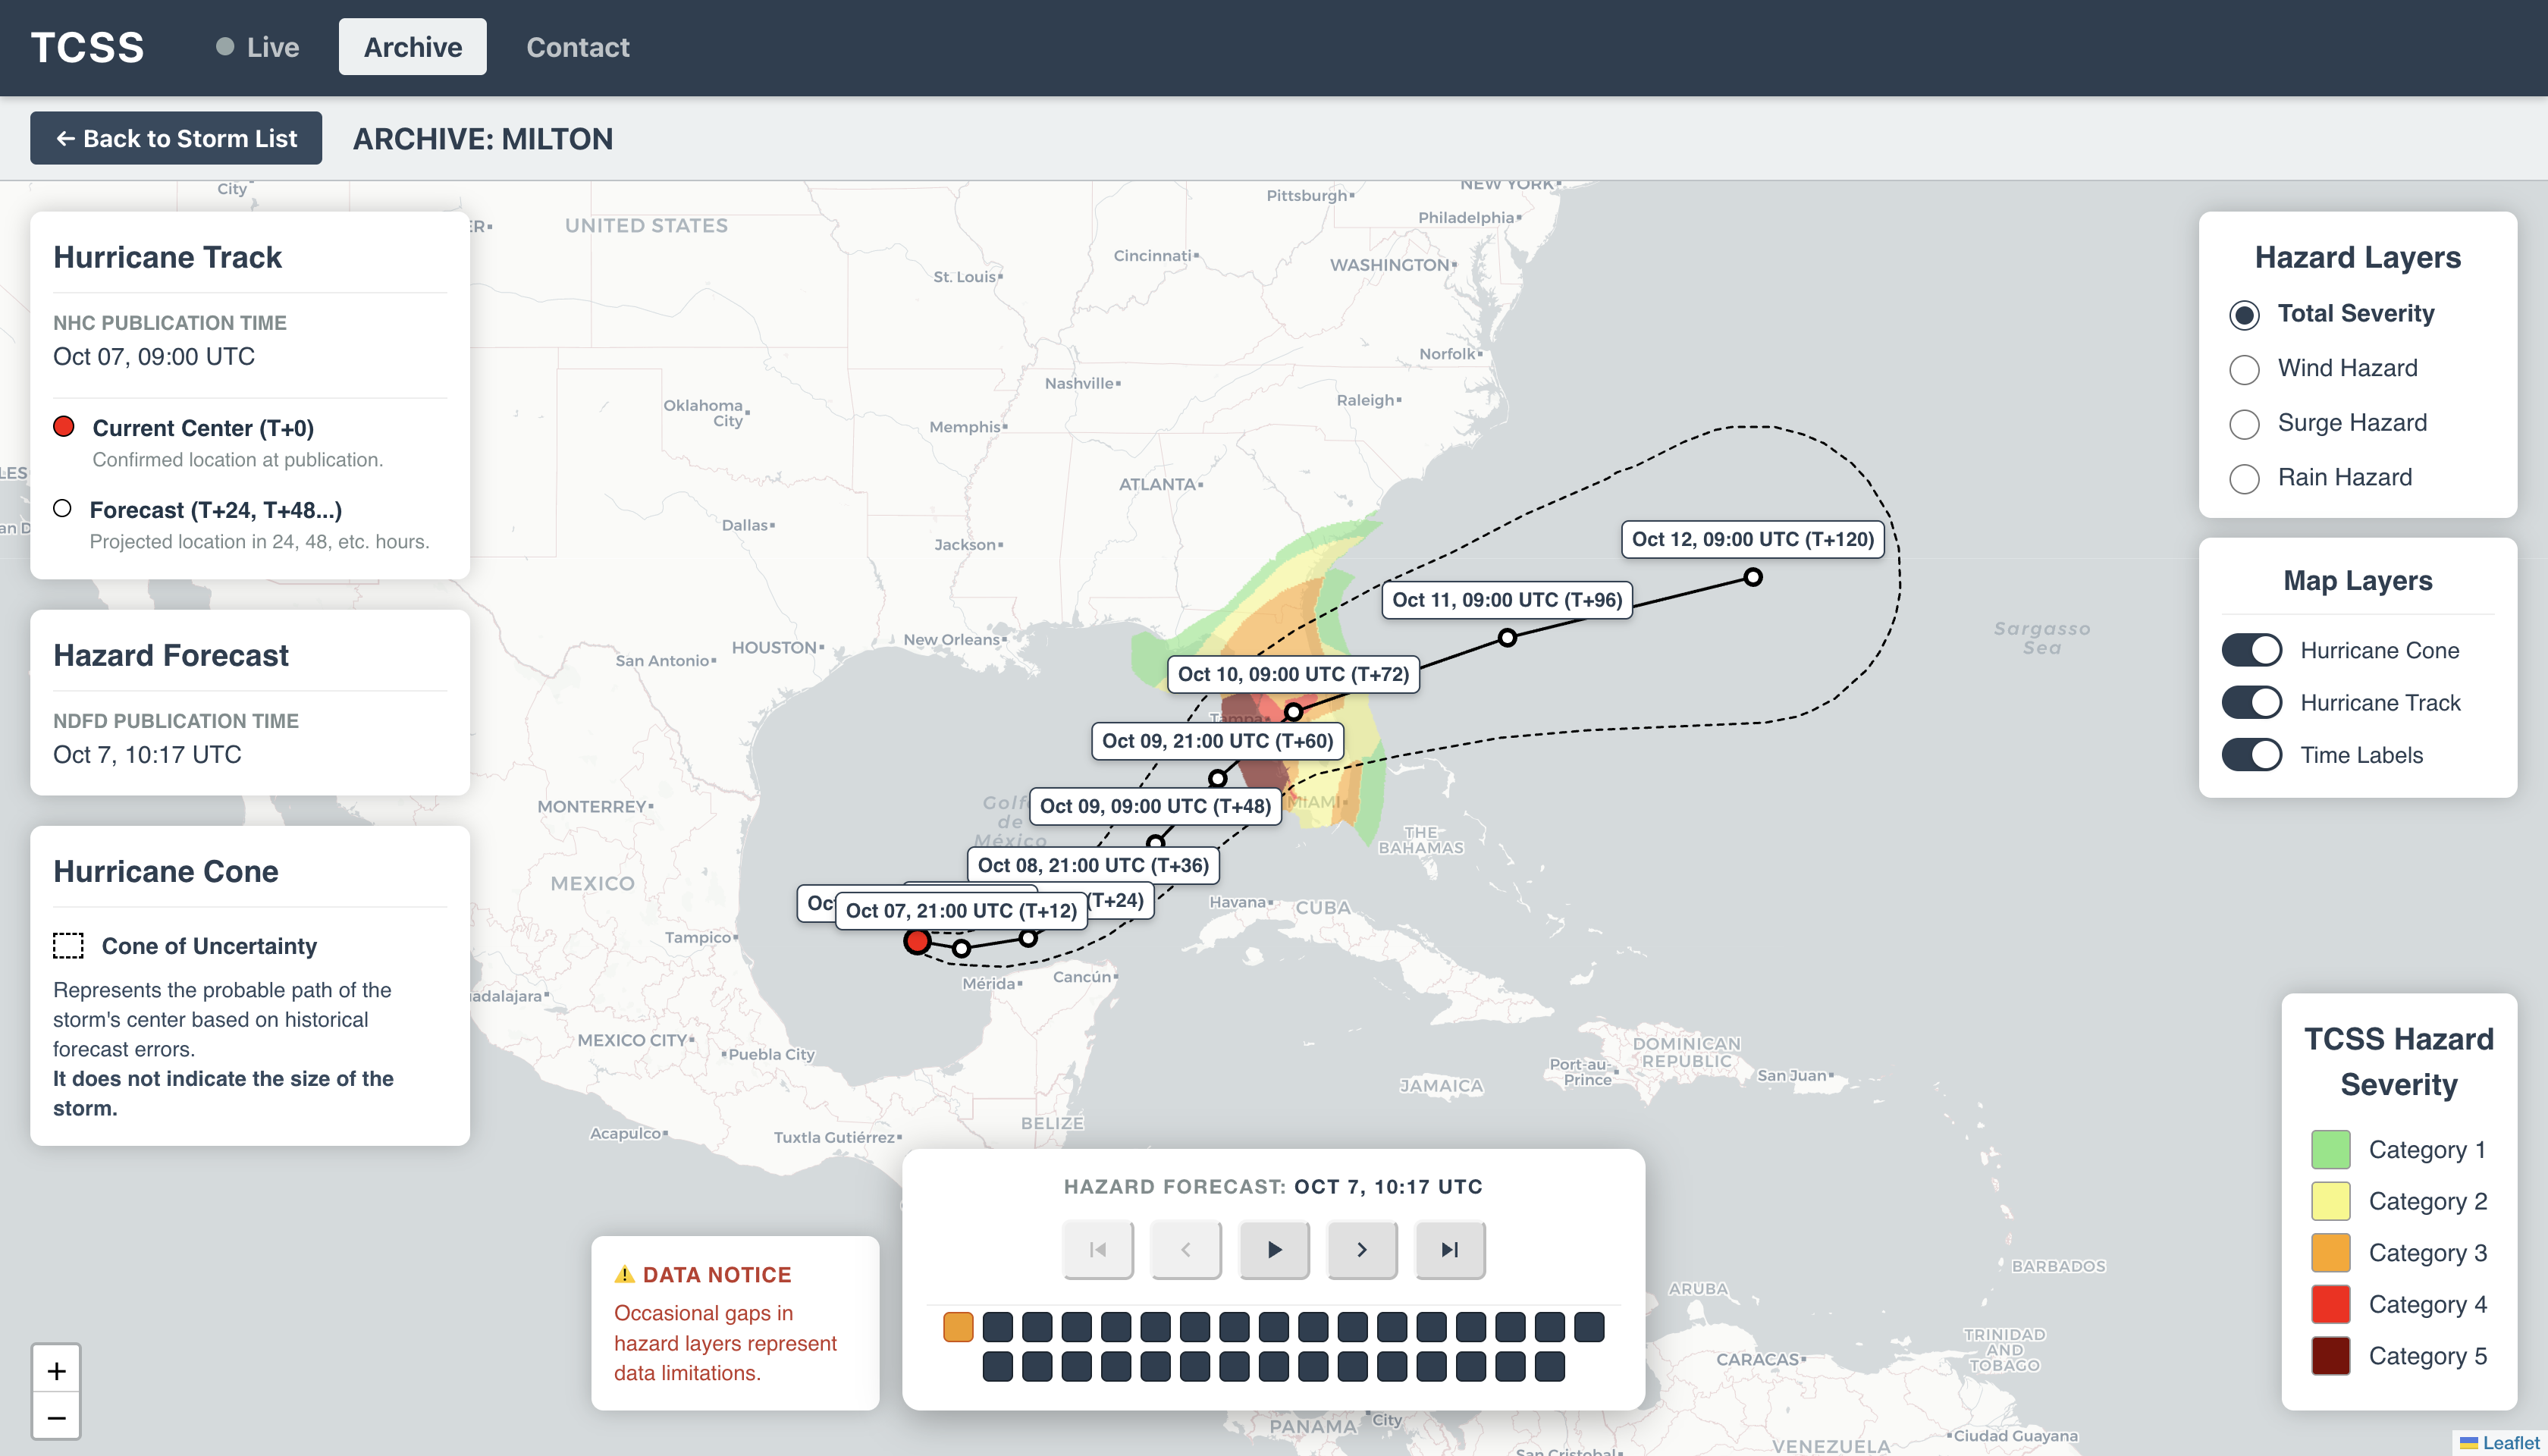
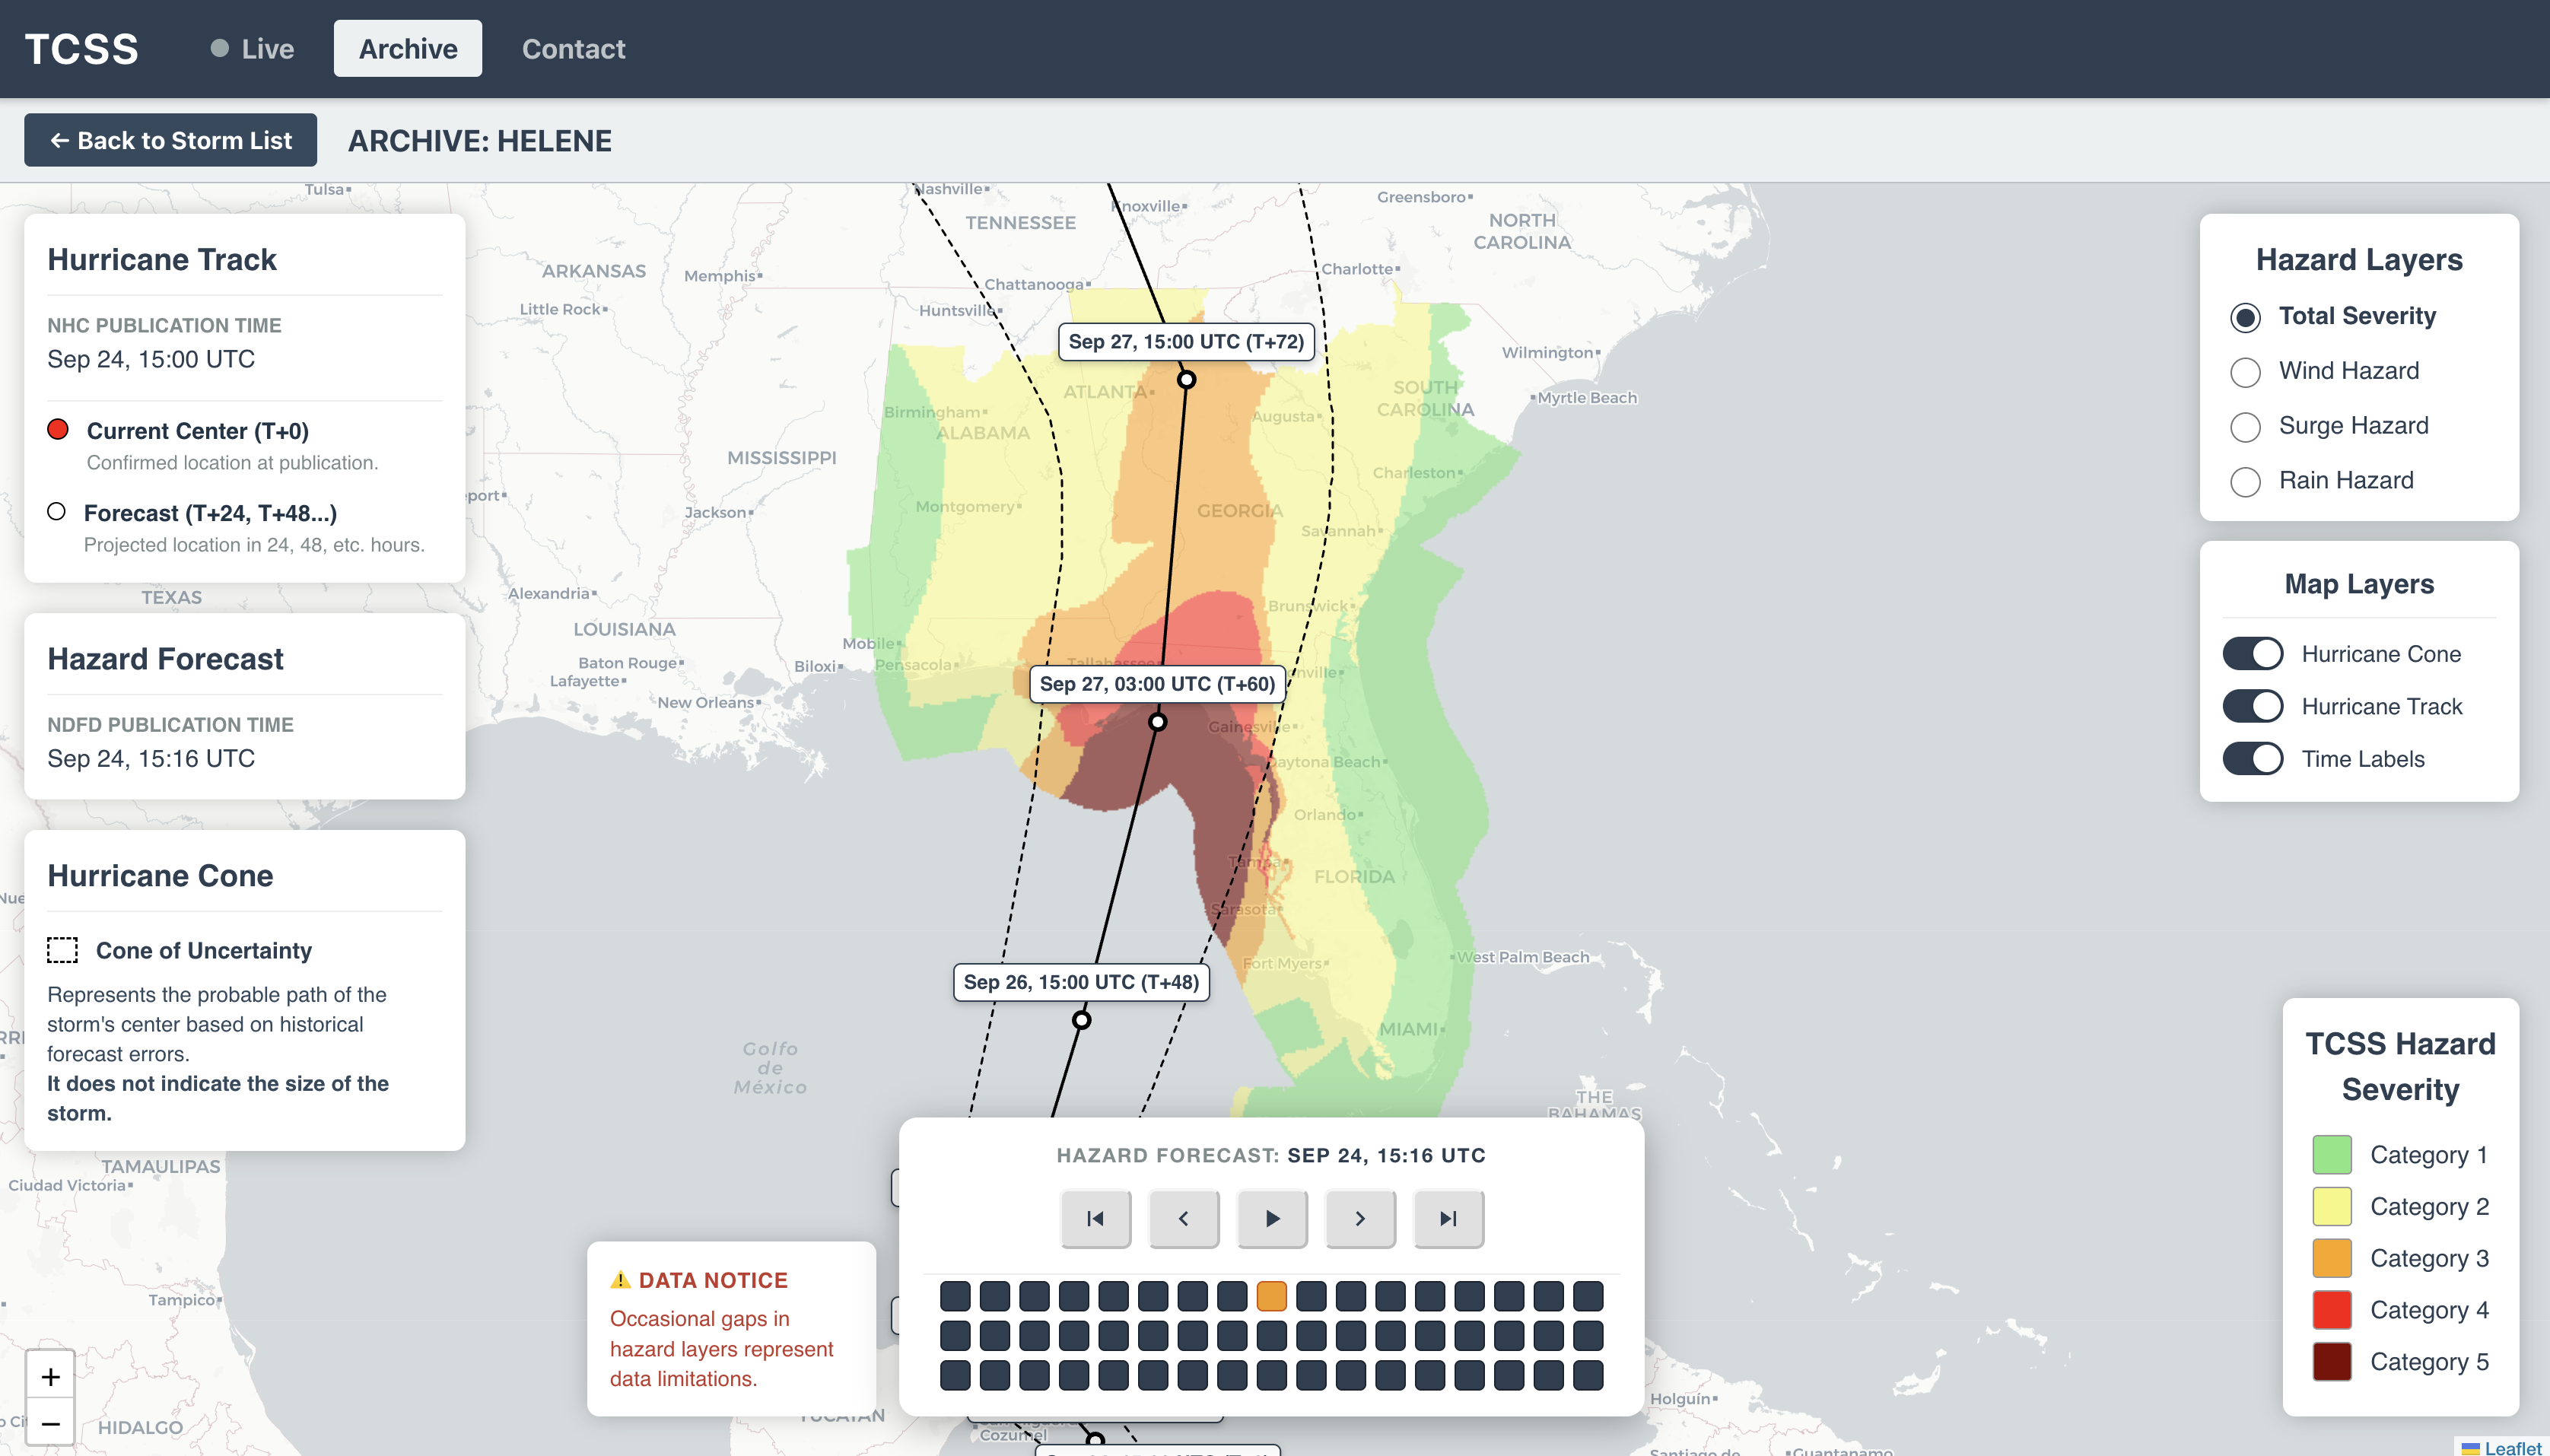
- Geospatial Analysis: Engineered a custom parser for NHC shapefiles, extracting forecast track coordinates and the "Cone of Uncertainty" polygons for native storage in PostgreSQL.
- Real-time Polling: Implemented a persistent worker system that polls NOAA servers every 15 minutes, automatically updating the live dashboard without user intervention.
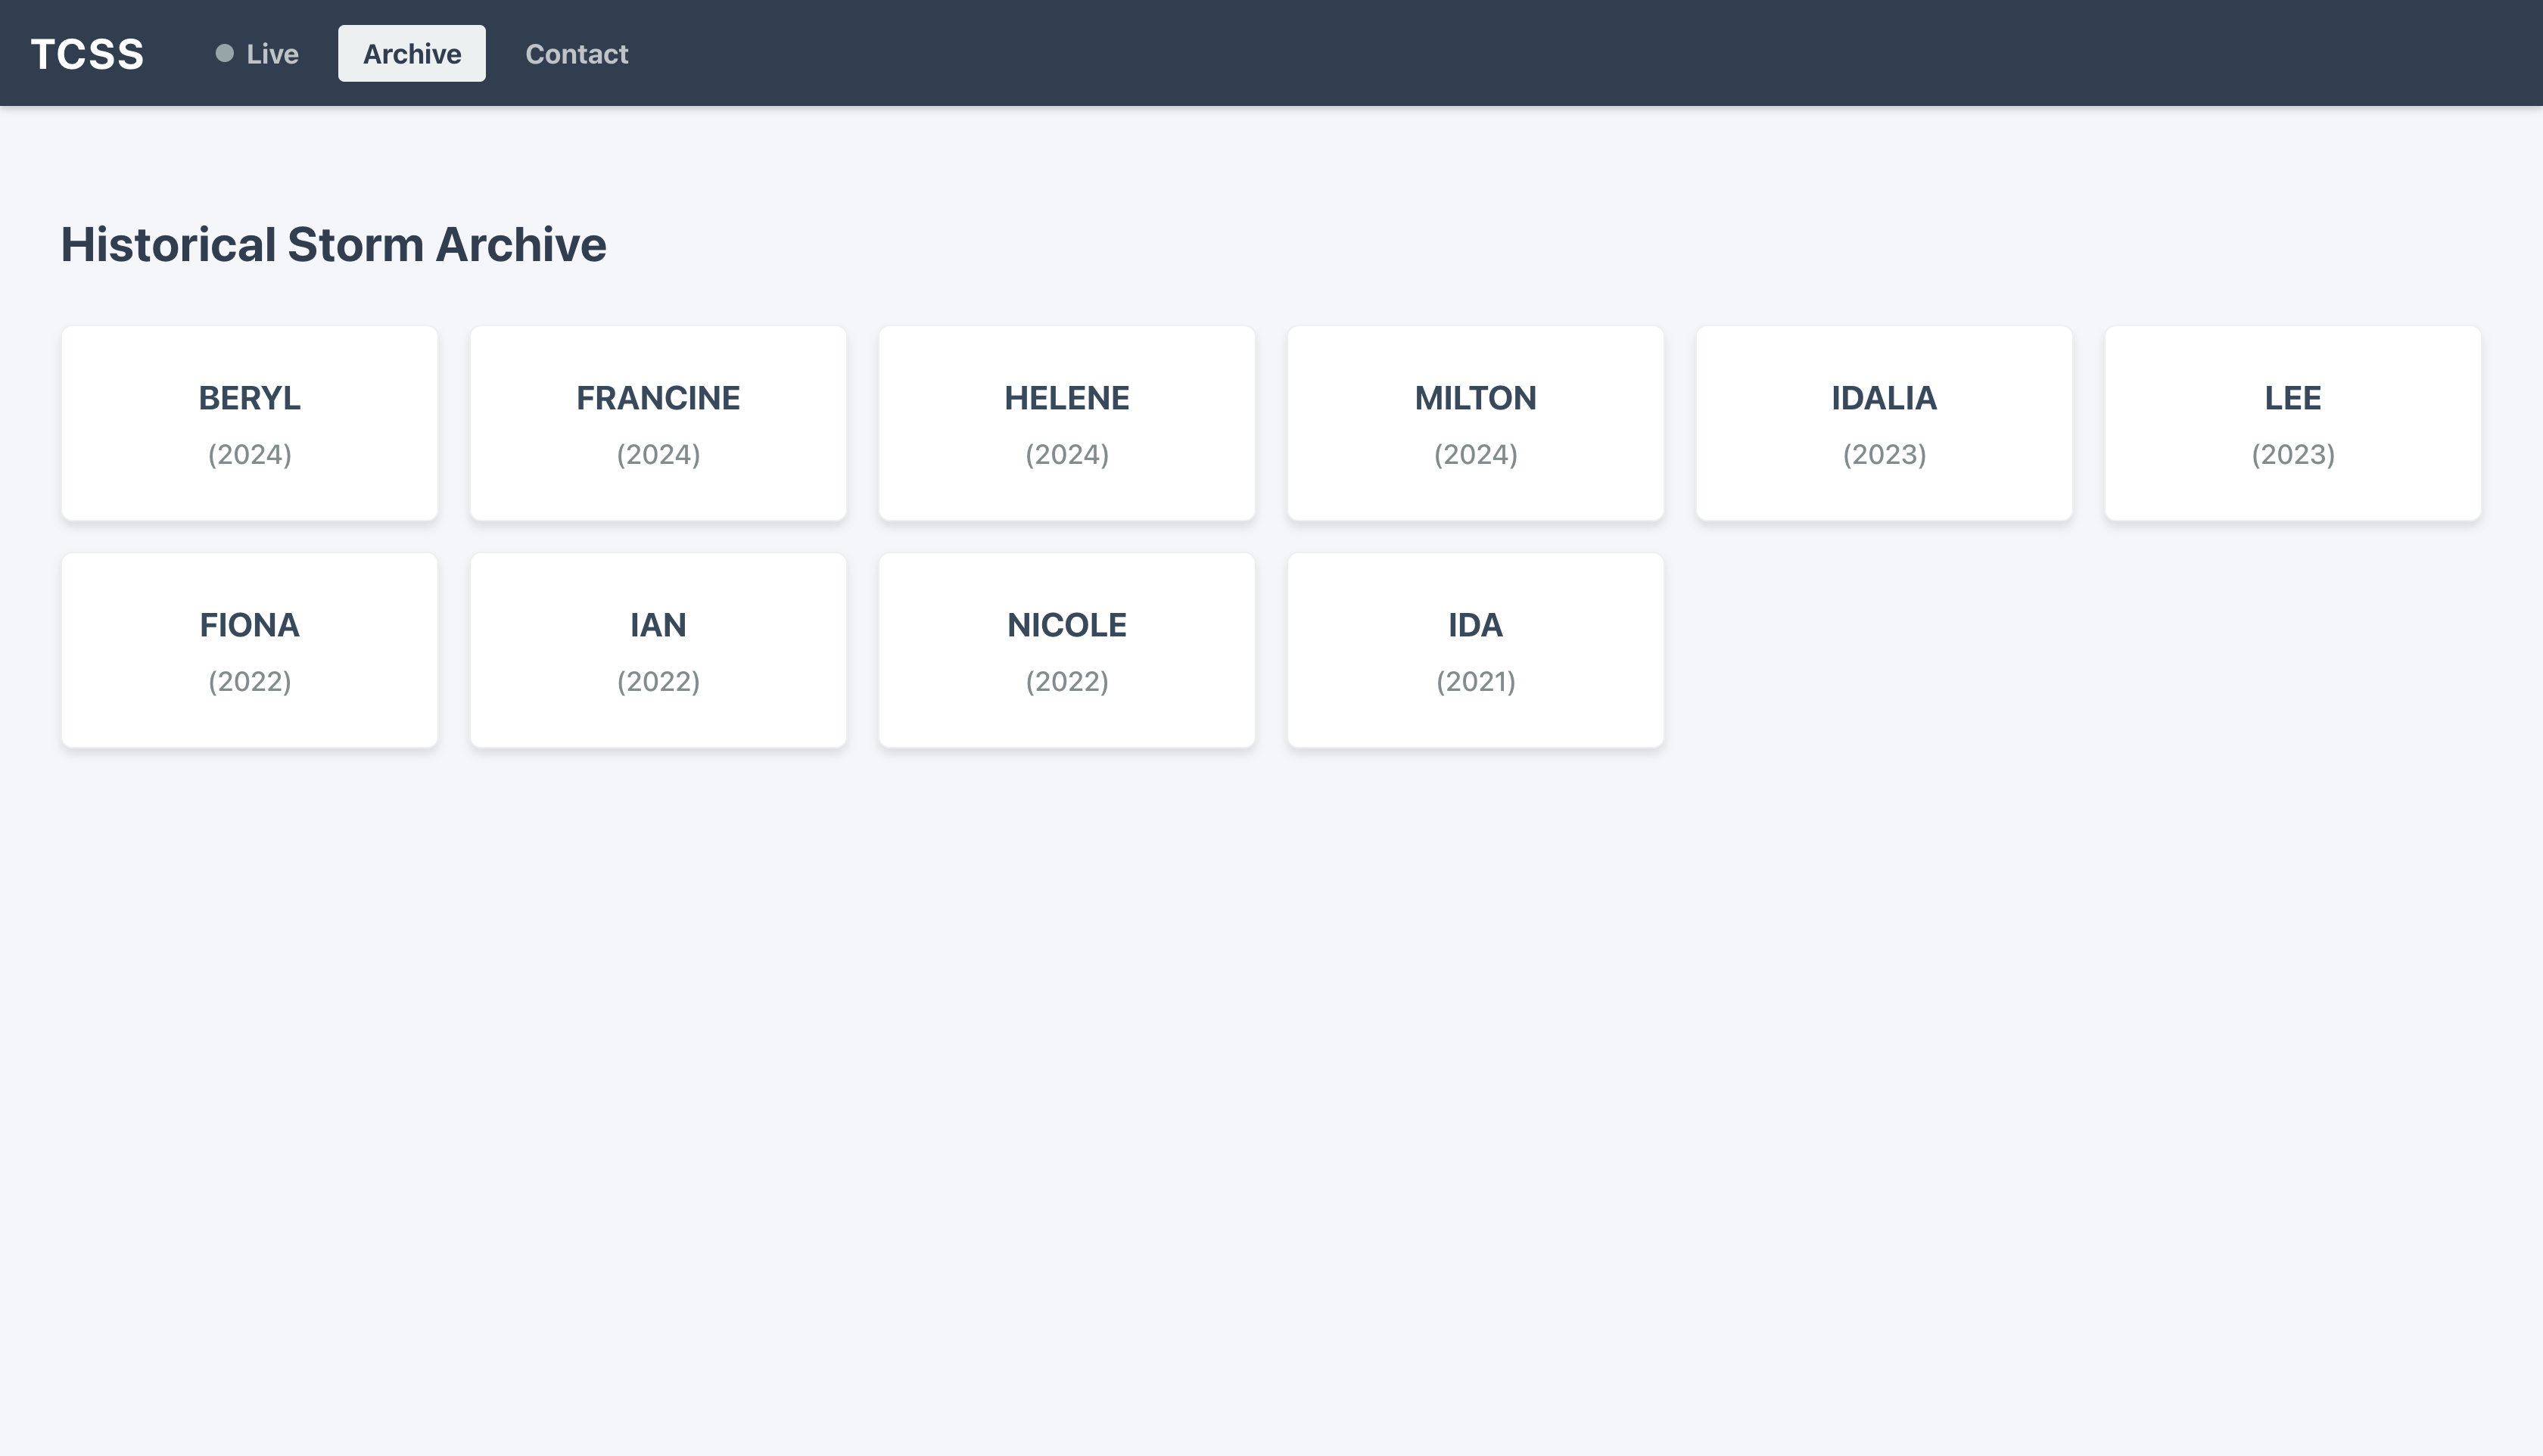
- Hurricane Archive Engineering: Curated and managed a comprehensive library of historical hurricane data, developing a specialized batch-processing engine to normalize and ingest legacy storm records for retrospective hazard analysis.
- Database Design: Utilized PostgreSQL with JSONB columns to store complex GeoJSON geometries, enabling fast retrieval and rendering of dynamic storm center coordinates and forecast Tau (time) steps.
03. Visualization & Interface
The frontend is a high-performance geospatial dashboard built with React and Leaflet, specifically architected to handle high-frequency temporal data.
- Temporal Playback Engine: Developed a custom "VCR-style" playback controller that allows users to traverse storm timelines, reconstructing historical hurricane evolution frame-by-frame with synchronized data overlays.
- Dynamic Layer Management: Implemented a modular toggle system and switches, allowing users to isolate specific hazards (wind, surge, rain) or toggle the "Cone of Uncertainty" to reduce visual clutter during analysis.
- State Synchronization: Engineered a robust state-management flow that maps backend database IDs to frontend temporal states, ensuring seamless transitions between live satellite feeds and archived historical events.
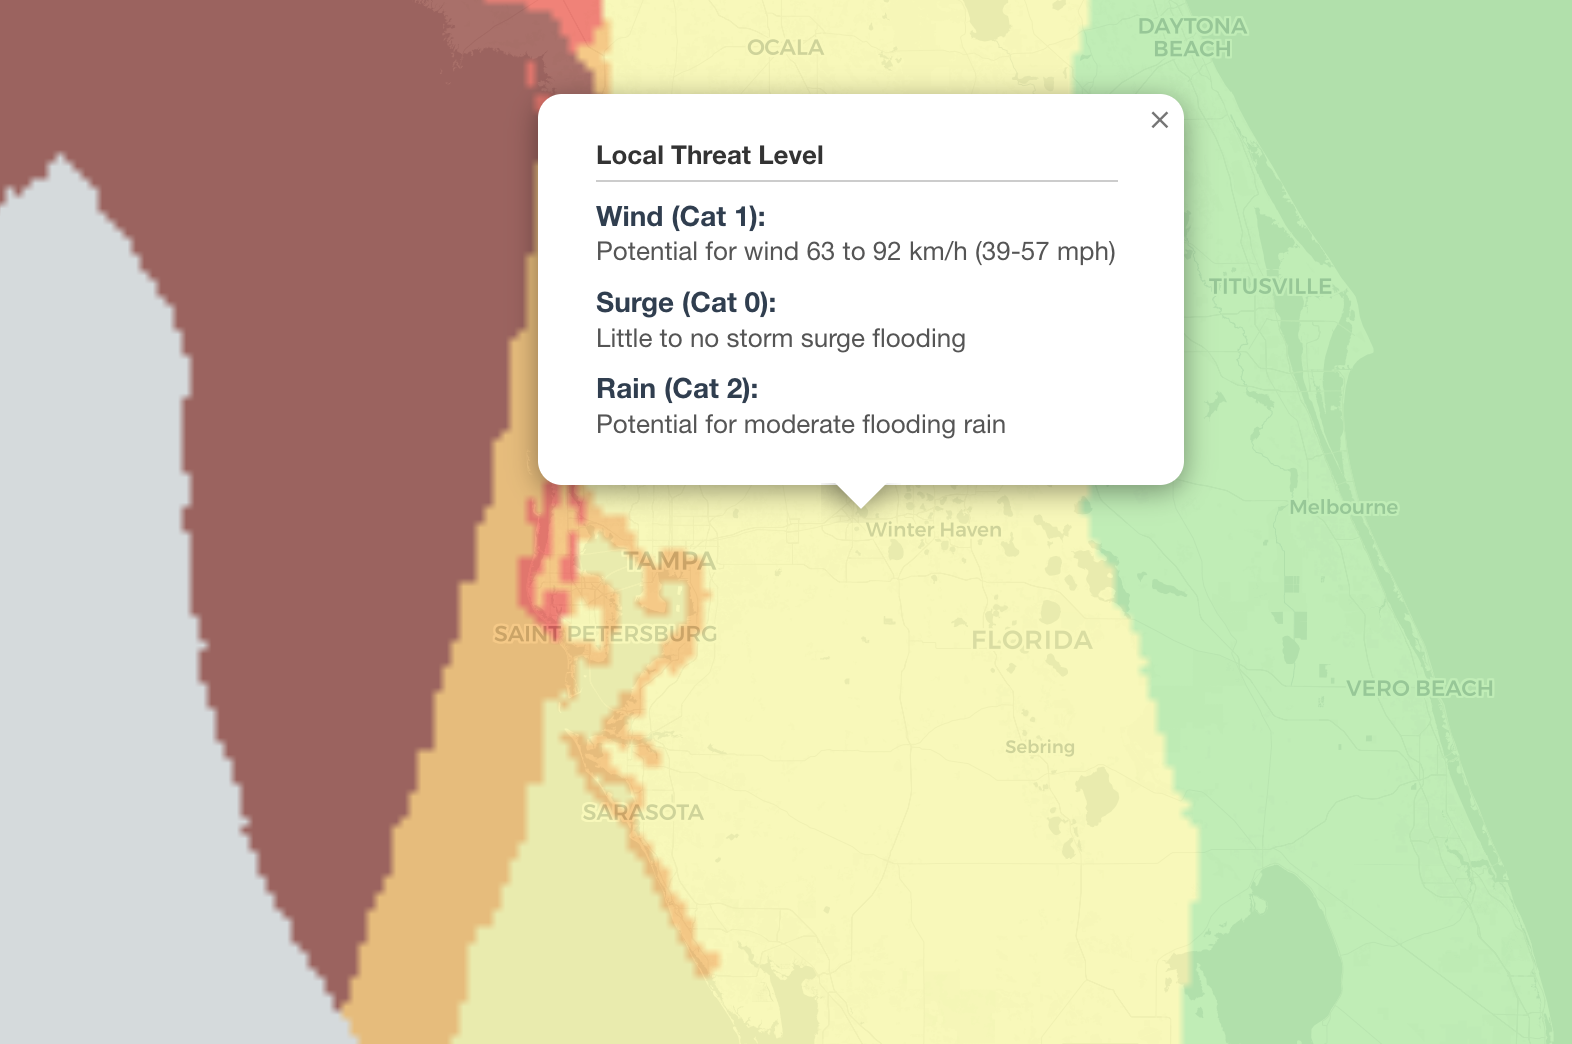
- Contextual Legend System: Designed an adaptive UI legend that explains meteorological visualizations (like the uncertainty cone) in real-time, grounding complex scientific data for non-expert users.